Healthy by design: How Crusoe burn-in tests every node before it reaches you
Every node on Crusoe Cloud runs through up to 30 targeted burn-in tests before it's available to customers. This post breaks down the full validation suite across node, GPU, and fabric domains, and explains how the system catches real failures before they reach your workloads.


Every node on Crusoe Cloud runs through up to 30 targeted tests before a customer ever touches it. This post covers exactly what we test, why each test matters, and how the system scales across GPUs.
Why burn-in and why it matters
Training and inference at scale demand infrastructure that performs reliably from the first hour to the last. Your team's ability to iterate, ship, and stay on schedule depends on every node in your cluster delivering consistent, full-performance compute every run, every time.
That's why, before any node joins Crusoe's fleet and becomes available to customers, it runs through burn-in: a structured set of validation tests that stress every major subsystem. The goal isn't just confirming hardware works. It's confirming every node delivers the full performance the hardware is designed for, under the real workloads customers actually run.
As cluster sizes scale, the probability of a system-level event increases across any of the interconnected components that make up a modern GPU cluster: power delivery, cooling, networking, storage, optics, and more. Pinckney et al. tracked failure rates across cluster sizes in production: at 8 GPUs, mean time between failures is around 47 days. At 1,024 GPUs, it drops to 8 hours. At 16,384 GPUs, it's 1.8 hours1. That's why Crusoe tests, validates, and monitors every node and cluster to ensure lower downtime and higher utilization for customers.
When a system-level event interrupts distributed training, the entire job stops while the cluster detects the issue, provisions a replacement, and rewinds to the last checkpoint. Without proper checkpointing, each interruption can cause significant delays in production timelines. Burn-in is how we catch those problems before they're your problem.
Most issues fall into two categories. Hard failures are straightforward: the GPU doesn't initialize or fails basic enumeration. NVIDIA's built-in Reliability, Availability, and Serviceability (RAS) Engine is designed to detect and surface these conditions automatically. Soft failures are harder: a GPU passes initial enumeration, performs within loose tolerances under light load, and only reveals the defect under sustained thermal and electrical stress. Burn-in is designed to catch these before they reach customers. It builds on NVIDIA's factory-level validation by adding system-level, workload-representative testing in the live virtualized environment customers actually use.
Beyond individual GPU health, burn-in validates the full stack: that BIOS/UEFI settings and device firmware are configured correctly, that PCI devices enumerate cleanly, that storage performance meets spec, that network interfaces are configured correctly, and that NVIDIA InfiniBand fabric connectivity meets performance and error rate thresholds for IB-enabled nodes. Without proper testing and validation from the cloud provider, even healthy nodes can fail unpredictably.
How the system works
Burn-in is implemented in Crusoe's internal testing framework. Tests are defined as YAML configuration files that specify what to run, which container images to use, and which SKUs a given test applies to. Tests run inside virtual machines on the node under test. This is deliberate: we want to validate the GPU in the same virtualized environment that customers will actually use, not just bare metal. We're not just testing hardware, we're testing the full stack from VM to GPU.
The test suite is living infrastructure. The tool that generates the coverage matrix scans test configuration files and auto-generates documentation when tests are added or SKU filters change. When we add a new GPU or SKU to our fleet, new tests are added to the configuration, the matrix regenerates, and coverage is tracked automatically. When we discover a new failure mode in production, we write a test that would have caught it and add it to burn-in. Burn-in doesn't only run on new nodes entering the fleet. After performing node upgrades, we re-run a targeted subset of tests scoped to what changed. A clean node can become a problem node after a bad update, and we treat post-update validation with the same rigor as initial qualification.
We also stay current with the latest testing frameworks from our partners, pairing them with the latest firmware, drivers, and NVIDIA CUDA versions.
The test matrix
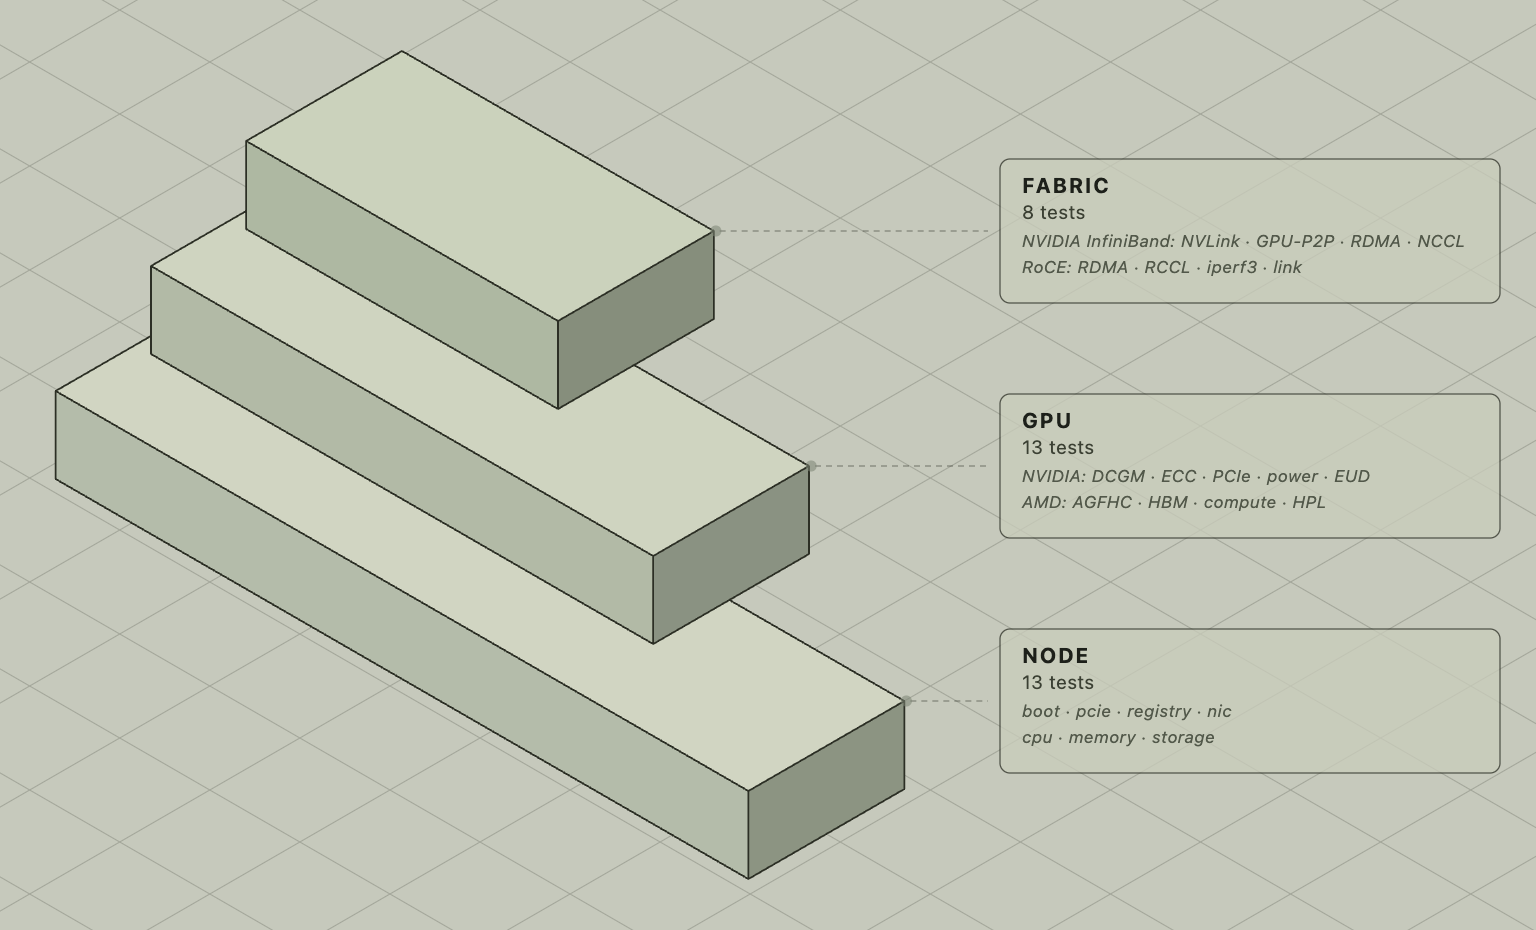
The test matrix is organized in three domains — node, GPU, and fabric — each following the same escalating pattern: sanity checks first, then validation, then performance benchmarks, then sustained stress. A core set of node tests runs universally; GPU and fabric tests activate based on the node's hardware configuration.
Node tests: What every node must pass
Every node, from CPU-only c1a instances to the latest GPU nodes, runs the full node test suite. These cover the invariants that must hold regardless of GPU configuration.
Sanity
node/global/sanity/boot verifies the node boots successfully and that basic system services are running before any further testing begins. node/global/sanity/pcie enumerates PCIe devices and validates that the expected GPUs, NICs, and NVMe controllers are present and properly configured; if a GPU is physically seated but not visible to the OS, this catches it. node/global/sanity/registry validates container registry connectivity and image pull capability, confirming the node can reach the tools it needs to run subsequent tests.
Validation
node/global/validation/nic validates Ethernet interface configuration, link state, and driver settings. A misconfigured NIC can pass basic enumeration and still deliver degraded throughput; this test verifies the interface is fully operational before any network-dependent tests run.
Performance
node/global/perf/cpu and node/global/perf/memory benchmark CPU throughput and host memory bandwidth using sysbench, establishing a performance baseline for every node.
Storage performance that doesn't meet spec directly degrades training throughput in ways that GPU diagnostics won't catch. A node with a degraded NVMe drive can pass all GPU checks but introduce write stalls whenever a checkpoint flushes. We run six storage tests across two categories. For block storage (the attached network volumes customers use for persistent data), node/global/perf/storage-block-bw, node/global/perf/storage-block-iops, and node/global/perf/storage-block-lat measure sequential and random read/write throughput, operations per second, and I/O latency at the access sizes that matter for model checkpoint writes and dataset loads. node/global/perf/storage-ephemeral-bw, node/global/perf/storage-ephemeral-iops, and node/global/perf/storage-ephemeral-lat run the same checks against the local NVMe.
Stress
node/global/stress/cpu applies sustained compute-intensive load to detect CPU thermal throttling or failures under realistic conditions. A CPU that passes light benchmarks can still throttle under the continuous load of running data pipelines alongside GPU training jobs.
NVIDIA GPU tests
Six tests run on all NVIDIA GPU nodes on Crusoe2, including L40S, A100, H100, H200, Blackwell, Blackwell Ultra GPUs and GB200 NVL72 systems, following the same sanity → validation → stress progression.
Sanity
gpu/nv/sanity/health runs a quick DCGM diagnostic sweep (levels 1-2) that checks GPU presence, driver health, and basic functionality. It surfaces error conditions that don't appear in enumeration alone, including ECC memory errors, thermal throttling events, and XID errors from previous runs, and establishes a clean baseline before deeper testing begins.
Validation
gpu/nv/validation/health runs DCGM at levels 3–4, the most comprehensive diagnostic tier, for deep memory, compute, and subsystem validation. This is used when thorough investigation is warranted: initial fleet qualification, post-repair verification, or investigating a suspected soft failure. Together, gpu/nv/sanity/health and gpu/nv/validation/health cover the full DCGM diagnostic range, from rapid triage to exhaustive validation.
gpu/nv/validation/ecc verifies that ECC memory is enabled and that no uncorrectable errors have accumulated. ECC (Error Correcting Code) must be enabled on all NVIDIA GPUs; it detects and corrects single-bit memory errors that would otherwise cause silent data corruption or crashes during long training runs. A GPU with ECC disabled passes basic health checks but poses a serious risk to production workloads.
gpu/nv/validation/pcie validates that PCIe link width and speed match the expected values. PCIe link degradation is an early warning sign that a GPU is failing: when a GPU has a poor physical connection (whether a bad riser, failing slot, or thermal issues), PCIe auto-negotiates to a lower speed or width to maintain stability. A GPU rated for Gen5 x16 running at Gen3 x8 will have 75% less bandwidth to the CPU. Any link running below its rated capability is flagged as critical.
gpu/nv/validation/power verifies GPU power delivery under sustained compute load using DCGM. This confirms the GPU can reach and sustain its rated TDP end-to-end. A GPU that can't reach its rated power envelope will underperform under real workloads and often won't reveal this until training is already running.
Stress
gpu/nv/stress/power tests GPU behavior under pulsed workloads, ramping load up and down 20 times. Some thermal and power delivery issues only appear under transient conditions, not sustained steady-state load. Sustained validation passes; the pulse pattern exposes marginal power delivery hardware that steady-state testing misses.
AMD GPU tests
AMD nodes run a distinct set of tests tailored to the AMD software stack3, covering validation and stress.
Validation
gpu/amd/validation/agfhc runs the AMD GPU Field Health Check (AGFHC) suite at Level 5, the most comprehensive diagnostic level available. This covers a full-node scan of compute units, HBM controllers, and the memory subsystem, establishing a comprehensive health baseline before stress testing begins.
Stress
gpu/amd/stress/hbm exercises AMD GPU high-bandwidth memory with sustained access patterns. The HBM-specific check is particularly important given the complexity of the HBM memory subsystem; memory controller issues that survive compute stress tests can surface under dedicated memory bandwidth pressure.
gpu/amd/stress/compute applies sustained arithmetic workload to stress AMD GPU compute units (GPU Stress Test).
gpu/amd/stress/full is the Integrated Exercise Test, combining compute, memory, and thermal load into a comprehensive single-GPU stress scenario.
gpu/amd/stress/hpl tests the ROCm High Performance Library, an AMD port of the standard HPL (High Performance Linpack) benchmark. It exercises the full HIP compute stack, memory bandwidth, and interconnect, producing a performance number we compare against expected values for the SKU. A node that passes stress tests but underperforms on HPL has a subtler problem that affects real workload throughput.
system/amd/stress/mixed applies a mixed workload that stresses AMD GPU, CPU, and host memory simultaneously. Unlike the GPU-focused tests above, this exercises the full system under concurrent pressure, the kind of load profile that emerges during real training runs where data pipelines and GPU computation are happening in parallel.
Fabric tests: IB and RoCE
Fabric tests run on all InfiniBand and RoCE-enabled nodes, validating the high-speed interconnect that distributed training depends on. The structure mirrors the GPU tests: universal fabric sanity first, then vendor-specific performance and stress validation.
Global Fabric Sanity and Performance
fabric/global/sanity/link runs a quick check that IB or RoCE links are up and operational before any RDMA-dependent tests begin. A link that's physically connected but negotiated into a degraded state fails here, before bandwidth tests waste time on a broken fabric.
fabric/global/perf/ethernet measures frontend Ethernet throughput between nodes using iperf3. This test runs in a loopback configuration between nodes, validating not just the interface but the switch fabric those nodes pass through. A misconfigured NIC or a bad cable shows up here.
NVIDIA InfiniBand
The four InfiniBand tests are deliberately layered to isolate where failures originate: local hardware versus fabric.
fabric/nv/perf/nvlink measures NVLink bandwidth between NVIDIA GPUs within a single node, using the node's own IP as the RDMA target. This isolates local IB health from fabric issues: if a node fails this test, the problem is definitively local (bad HCA, driver, or GPU-Direct RDMA stack).
fabric/nv/perf/gpu-p2p measures NVIDIA GPU-to-GPU bandwidth using NCCL in a single-node configuration, testing intra-node NVLink bandwidth without cross-node coordination. The combination with fabric/nv/perf/nvlink provides clear fault attribution: single-node passes but multi-node fails means the problem is in the IB fabric. Both fail means the node has a local NVLink problem.
fabric/nv/perf/rdma-bw is a true multi-node InfiniBand stress test run in a loopback configuration. It validates that the IB fabric is healthy, that the node can establish connections to peer nodes, and that bandwidth and error rates are within acceptable bounds. It also validates that our virtualization layer meets bare-metal RDMA performance thresholds. InfiniBand misconfiguration is subtle: a node can appear healthy on single-node workloads and only reveal fabric issues under multi-node communication.
fabric/nv/stress/collective runs NVIDIA's Collective Communications Library (NCCL) over InfiniBand across multiple nodes. NCCL is what every distributed PyTorch and JAX training job uses for GPU-to-GPU communication. If NCCL all-reduce doesn't work correctly at this stage, distributed training won't work in production.
AMD RoCE (RDMA over Converged Ethernet)
fabric/amd/perf/rdma-bw tests GPU-Direct RDMA bandwidth between node pairs in a ring topology, validating all 8 NICs per node individually. It includes fault attribution logic: if test A to B fails, the test runs A to C to determine which node is responsible, avoiding false positives that would pull a healthy node from service.
fabric/amd/stress/collective runs AMD's RCCL (ROCm Collective Communications Library) over RoCE across multiple nodes. RCCL is what distributed PyTorch and JAX training jobs use for GPU-to-GPU communication on AMD hardware. If RCCL all-reduce doesn't work correctly at this stage, distributed training on AMD nodes won't work in production.
What this means in practice
Burn-in catches real problems. It catches nodes with bad BIOS settings that result in power delivery problems under sustained load. It catches GPU memory errors that pass initial enumeration but accumulate during training. It catches IB port misconfiguration that silently degrades NCCL bandwidth for distributed training jobs. It catches NVMe drives with latency spikes that cause checkpoint writes to stall.
Nodes that fail burn-in don't ship. They get triaged, repaired or replaced, and depending on the nature of the fix, re-run through either the full suite or a targeted subset of tests scoped to the repair. This is also not a static checklist. When we discover a new failure mode in production, we write a test that would have caught it and add it to burn-in.
Beyond automated burn-in, Crusoe validates new cluster deployments with real distributed workloads before handoff, running multi-node PyTorch jobs to confirm the full software stack behaves correctly under customer-representative load.
We're publishing this because the details matter. If you're running multi-week training runs or latency-sensitive inference workloads, the reliability of the hardware underneath you directly affects your research productivity and your cost per experiment. Crusoe backs this with a 99.5% uptime SLA for GPU-enabled virtual machines, details at crusoe.ai/resources/customers.
Burn-in reduces the frequency of in-production failures, but no pre-fleet test eliminates them entirely. For customers running large distributed workloads on Crusoe Managed Kubernetes, AutoClusters handles failures that do occur, detecting unhealthy nodes and replacing them automatically from a burn-in validated spare pool, typically within minutes of detection.
If you'd like to go deeper on our validation process, the full technical details are in our docs. To explore Crusoe Cloud's GPU offerings visit crusoe.ai/cloud, or talk to our team about the infrastructure your workloads need at crusoe.ai/contact-sales.
Citations
- Pinckney, N., Cai, H., Wu, C., Tanaka, Y., Chiang, P., Huang, J., ... & Asanović, K. (2024). "Revisiting Reliability in Large-Scale Machine Learning Research Clusters." arXiv:2410.21680. [Link]
- NVIDIA Data Center GPU Manager (DCGM) documentation: https://docs.nvidia.com/datacenter/dcgm/latest/user-guide/dcgm-diagnostics.html
- AMD GPU Field Health Check (AGFHC) documentation: https://instinct.docs.amd.com/projects/gpu-operator/en/latest/test/agfhc.html