Debugging a GPU fleet shouldn't feel like detective work
Crusoe Command Center is on by default across Crusoe Cloud resources. No stack to deploy, no agents to wire up. Here's how teams use it to debug GPU fleets faster, from in-console dashboards to Grafana to MCP-powered agents.


Debugging a GPU fleet shouldn't feel like detective work.
But it often does. One Xid error can quietly slow down an entire training job, and when you're staring at a cluster with thousands of GPUs, finding the culprit can eat up hours you don't have.
That's the problem we set out to eliminate with Crusoe Command Center.
It's on by default now across resources on Crusoe Cloud. The moment you spin up a resource, it starts collecting metrics and logs from everything on Crusoe Cloud. No stack to deploy. No agents to wire up by hand.
And the place it's paid off fastest? Troubleshooting.
Problems that used to take hours to track down now take seconds. Even better, our support team can see the same live view of your fleet that you do. So when you reach out, we're already looking at your telemetry instead of asking you to reproduce the issue from scratch.
What's been the most fun to observe is how differently people use it. Same telemetry underneath, but everyone reaches for it in their own way depending on the job in front of them. Here's what we've seen, and what we've built for each.
In-console visibility: the fast path
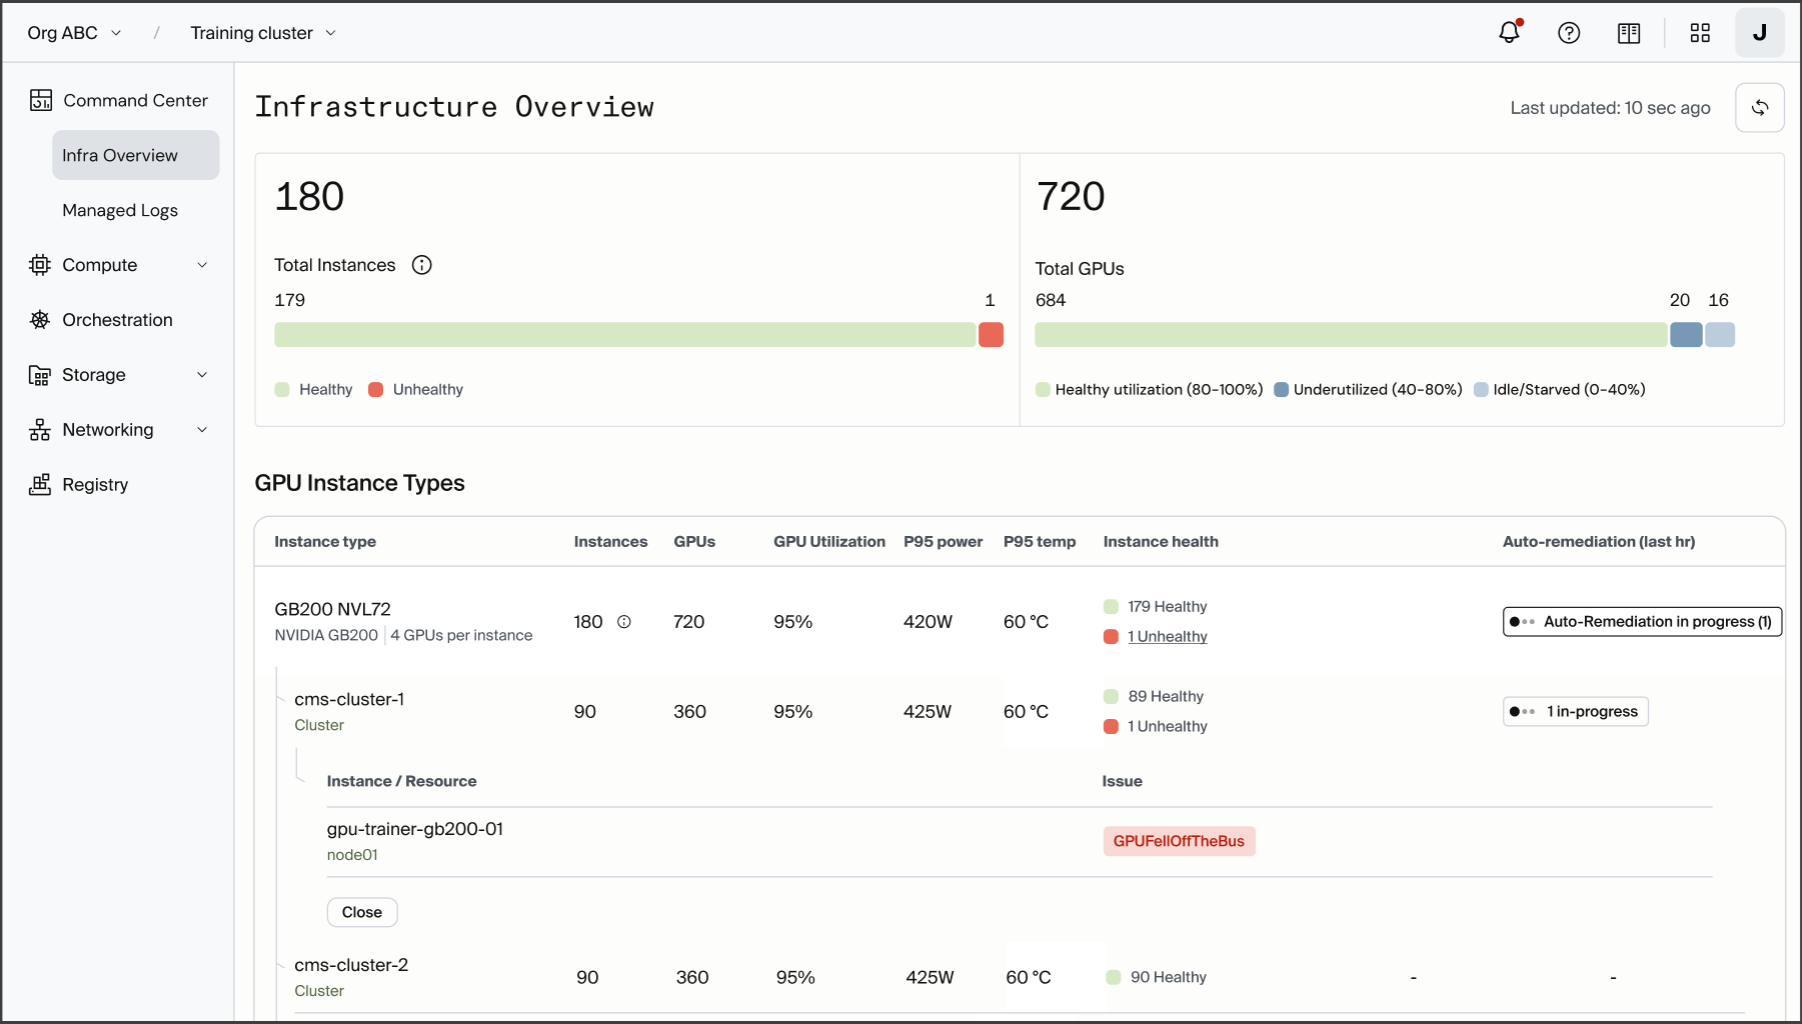
Sometimes you just want to open a screen and see what's wrong.
That's the most common pattern, and it's the simplest. The built-in dashboards cover your Crusoe Cloud resources, from compute to storage to Infiniband, with nothing to configure and nothing to deploy. For most teams it's the quickest route from "something feels off" to "here's the exact node." It's where we'd tell you to start.
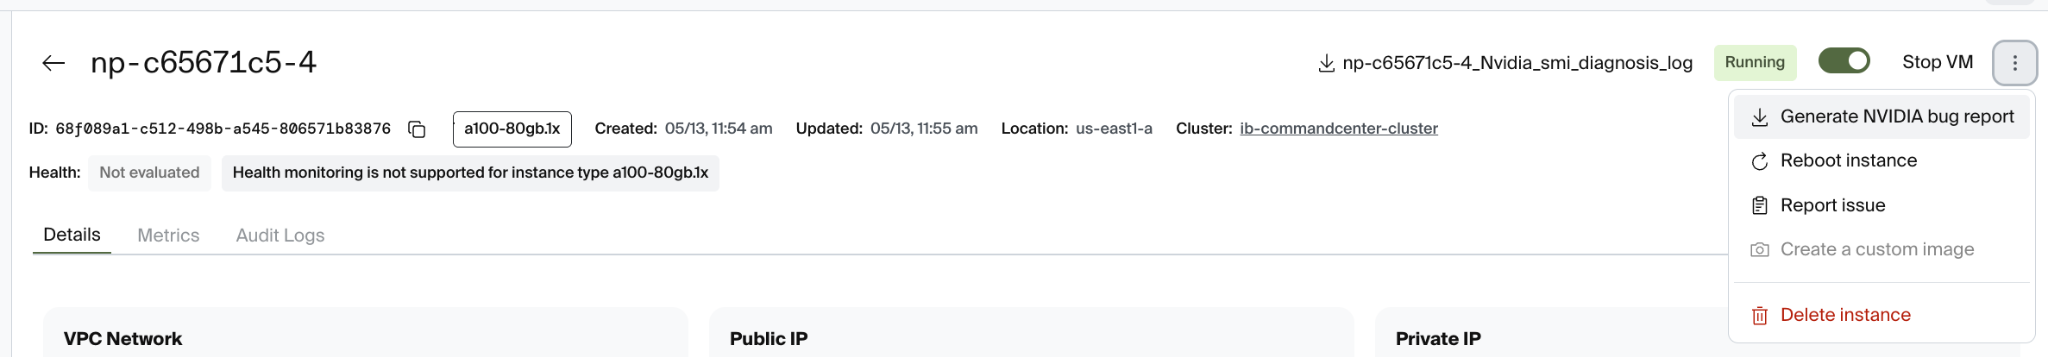
We also baked help right into the console. When a node starts acting up, you can generate a bug report on the spot, no SSH or SCP required. It shows up in the console for download, and it also lands with our support team automatically. By the time someone picks up your ticket, they're already looking at the same report you are.
Grafana, powered by Telemetry Conduit: when you need more
As your fleet grows, you may want your own layout, your own panels, your own stack.
That's what Telemetry Conduit is for. It exposes a managed Prometheus endpoint that scrapes all your compute, storage, and Infiniband metrics. Some of our customers already run their own self-managed Grafana, so they add that endpoint as a data source and pull Crusoe metrics straight into the dashboards they already use.
We run Grafana ourselves, too. When we achieved NVIDIA Exemplar Cloud validation for NVIDIA HGX B200 for training, everything came down to three questions we had to answer across thousands of GPUs:
Is the fleet fully utilized? Are there any Xid or ECC errors? Is the NVIDIA Quantum InfiniBand fabric healthy?
So we built Grafana views that you can import, one for each question, off the exact same metrics our console dashboards use.
First, utilization. A cluster roll-up shows total GPUs, nodes, and average utilization at a glance, with per-node utilization, memory, and power draw underneath, plus a ranking of the busiest nodes. During validation, this told us in one look whether all 2,720 GPUs across 340 nodes were actually pulling their weight. The thermal panel confirmed we were holding temperature with zero GPUs throttling.

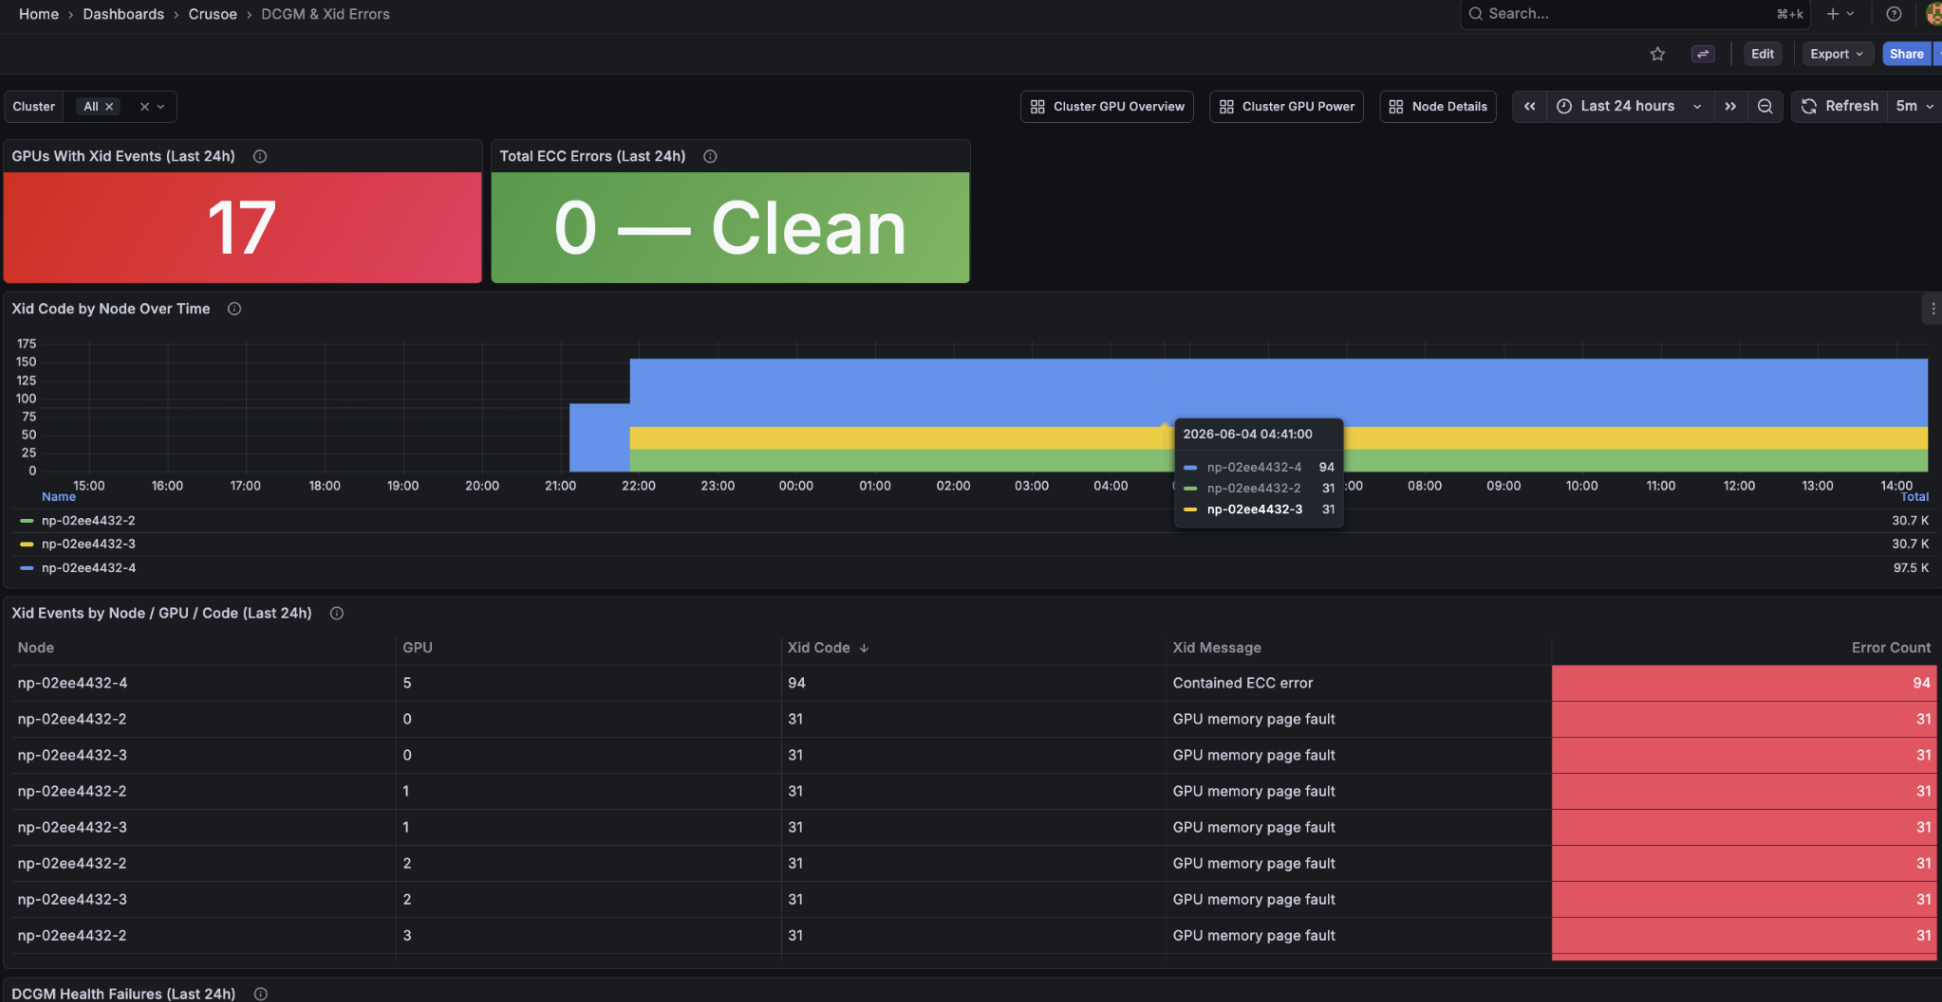
Second, health. This one watches Xid events and ECC errors across the whole fleet, so an underperforming GPU jumps out instead of hiding in the average. It surfaces Xid codes by node over time, DCGM health failures, and slow-node signals like uncorrectable ECC. These are the early warnings that separate a dying GPU from a healthy one, before it drags down a run.
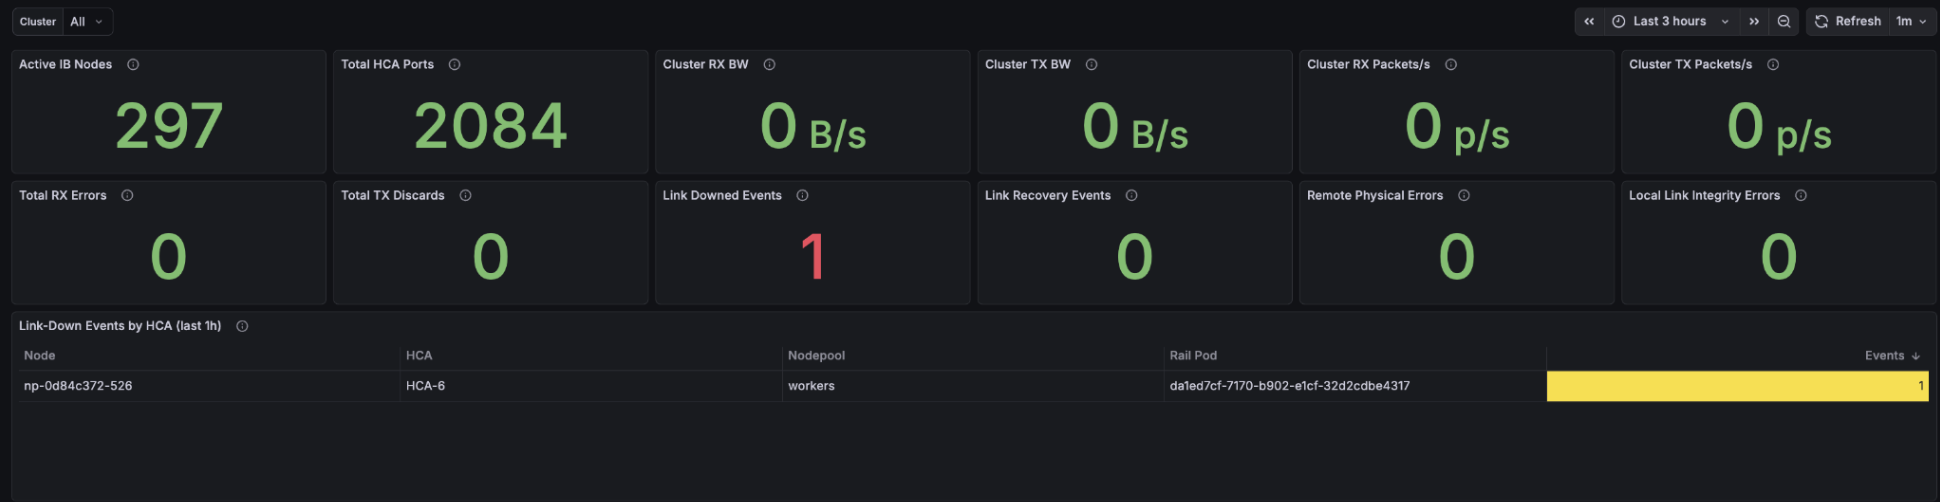
Third, the fabric. On NVIDIA Quantum InfiniBand, one degraded link can affect collective communication across an entire job. So we put every error counter side by side: RX errors, TX discards, link-down events, remote physical errors, local link integrity errors. If a counter climbs above zero, you see it right away. Per-node bandwidth, utilization, and back-pressure are one click away.
That's the flexibility Telemetry Conduit provides. Same metrics that power our built-in dashboards, reshaped into whatever view your workflow actually needs.
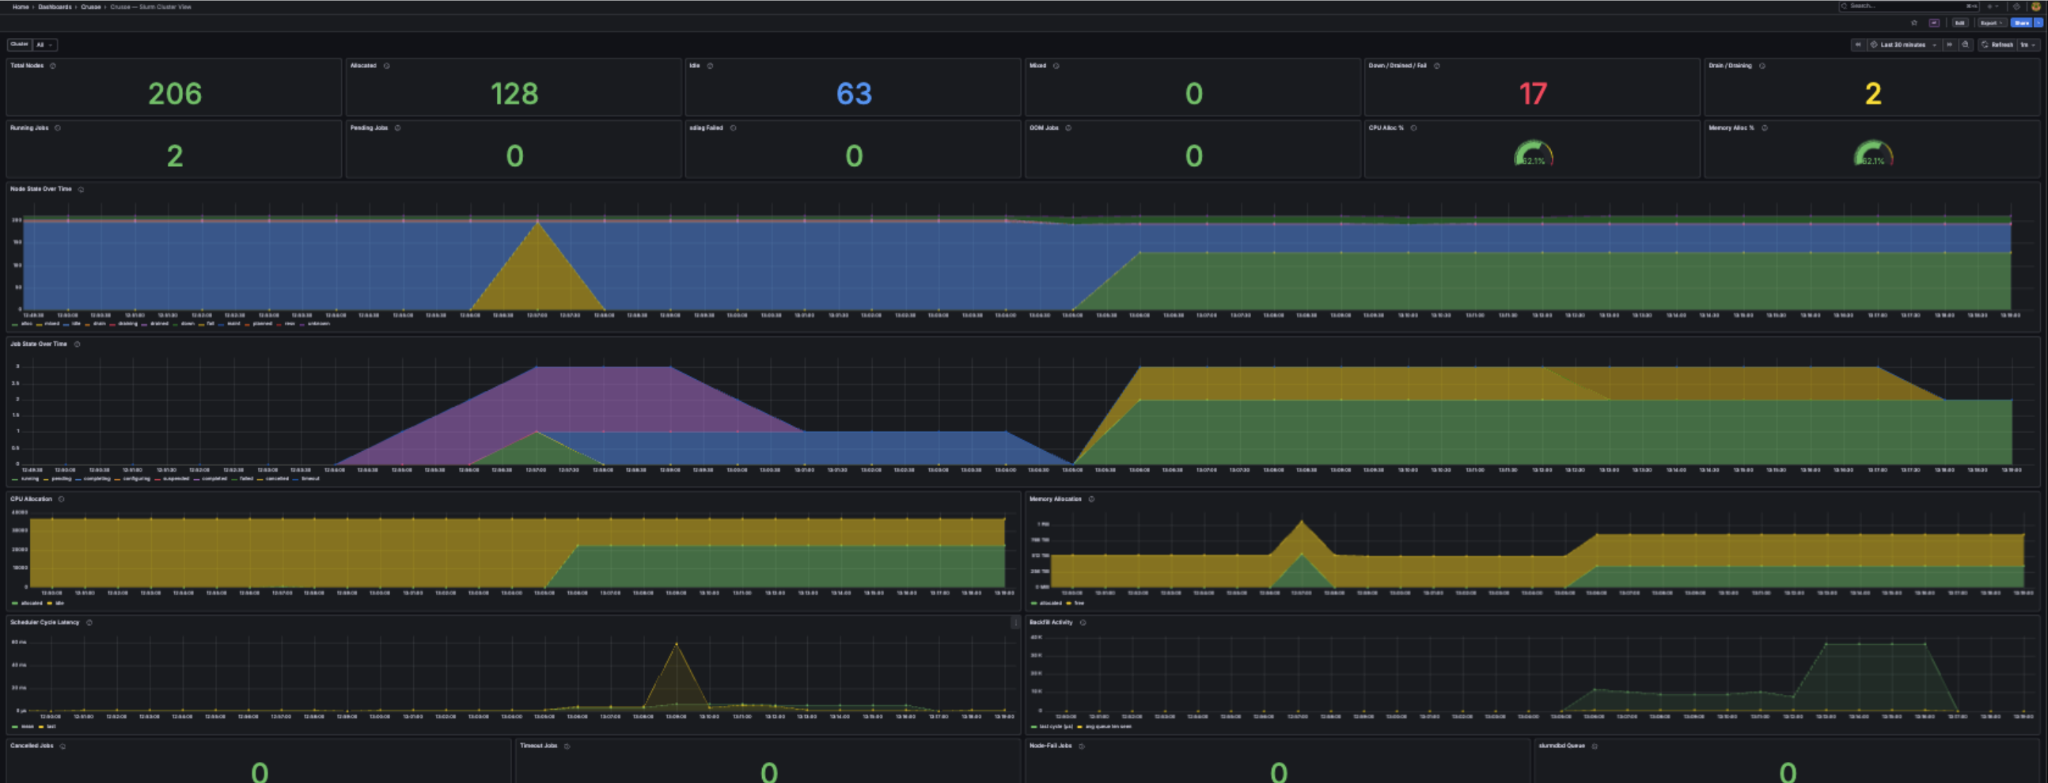
Slurm shops have a home here too. For scheduled workloads, infrastructure metrics only tell half the story. So alongside the Command Center GA, we also GA'd Crusoe Managed Slurm on CMK, a custom Slurm Operator forked from the upstream SchedMD Slinky project. The same Grafana setup drops Slurm metrics right next to your infrastructure telemetry.
And if you're running multi-cloud, the same Prometheus endpoint exports to Datadog, Splunk, and others. Logs come through the LogsQL API, with streaming via the /logs/tail endpoint. No need to stand up yet another pipeline for your Crusoe resources. Just pull them into whatever you already run.
MCP: let the agent do the looking
Here's the pattern we're most excited about right now.
More and more, teams want their coding agents to investigate cluster health directly without a human copy-pasting metrics and logs back and forth. The Crusoe MCP server is built for exactly that, the workflow where the agent does the digging.
We just added PromQL and Logs API support to MCP, which makes that digging a whole lot easier. An agent can now query DCGM metrics, InfiniBand metrics, and JournalD logs over any time range, and tie it all back to nodepool membership.
That last part is what makes it powerful. The thing that slows humans down is connecting the dots. An agent can spot an Xid spike in the metrics, pull the JournalD logs from that node, and map it to the right nodepool, all in one pass. Instead of opening your assistant to a blank query box, you open it to an investigation already in motion.
Or you can keep it simple. Just ask, in plain English, for GPU or NVIDIA Quantum InfiniBand health over the last few hours, and let the agent put it together. No query language required.
Getting started
All you need is a Crusoe Cloud account.
Spin up a VM or CMK cluster with crusoe-watch-agent pre-enabled, or drop the agent onto your existing infrastructure, and open the in-console dashboards to see your fleet right away.
Want the same Grafana suite we use for our own validation? We open-sourced it. The Solutions Library on GitHub has the pre-built dashboard templates and a full deployment guide.
Ready to dig in?
- Get started: Review the Command Center documentation to configure your clusters.
- Deep dive: Explore our Solutions Library on GitHub for pre-built dashboard templates.
- Need help? Reach out to your account team or contact support for assistance.